Fairness Metrics
Overview of the Fairness Metrics
Oracle Guardian AI Project outlines a set of bias/fairness metrics, based on developments in the ML fairness community [1], to assess and measure if a model/dataset complies with a specific metric. The provided metrics all correspond to different notions of fairness, from which the user should carefully select while taking into account their application’s context.
The metrics each implement different criteria defining how a model or dataset should be unbiased toward a protected attribute. If an attribute is protected, then each of its unique values (for example, “male”, “female” or “other”) are considered subgroups that should be protected in some way so as to have equal outcomes from the model. These types of fairness metrics are known as group fairness metrics.
We provide a table summarizing the fairness metrics in the GAI package. Choosing the right fairness metric for a particular application is critical; it requires domain knowledge of the complete sociotechnical system. Moreover, different metrics bring in different perspectives and sometimes the data/model might need to be analyzed for multiple fairness metrics. Therefore, this choice is based on a combination of the domain, task at hand, societal impact of model predictions, policies and regulations, legal considerations, etc. and cannot be fully automated. However, we hope that the table below will help give some insights into which fairness metric is best for your application.
Machine learning models that decide outcomes affecting individuals can either be assistive or punitive. For example, a model that classifies whether or not a job applicant should be interviewed is assistive, because the model is screening for individuals that should receive a positive outcome. In contrast, a model that classifies loan applicants as high risk is punitive, because the model is screening for individuals that should receive a negative outcome. For models used in assistive applications, it is typically important to minimize false negatives (for example, to ensure individuals who deserve to be interviewed are interviewed), whereas in punitive applications, it is usually important to minimize false positives (for example, to avoid denying loans to individuals that have low credit risk). In the spirit of fairness, one should therefore aim to minimize the disparity in false negative rates across protected groups in assistive applications whilst minimizing the disparity in false positive rates for punitive applications. In the following table, we have classified each metric based on whether or not it is most appropriate for models used in assistive or punitive applications (or both). For further explanations, please refer to this book.
Overview of the Fairness Metrics
Metric |
Dataset |
Model |
Punitive |
Assistive |
Perfect score means |
|---|---|---|---|---|---|
Consistency |
✓ |
NA |
NA |
Neighbors (k-means) have the same Labels |
|
Smoothed EDF |
✓ |
NA |
NA |
Sub-populations have equal probability of positive label (with log scaling of deviation) |
|
Statistical Parity |
✓ |
✓ |
✓ |
Sub-populations have equal probability of positive prediction |
|
True Positive Rates |
✓ |
✓ |
Sub-populations have equal probability of positive prediction when their true label is positive |
||
False Positive Rates |
✓ |
✓ |
Sub-populations have equal probability of positive prediction when their true label is negative |
||
False Negative Rates |
✓ |
✓ |
Sub-populations have equal probability of negative prediction when their true label is positive |
||
False Omission Rates |
✓ |
✓ |
Sub-populations have equal probability of a positive true label when their prediction is negative |
||
False Discovery Rates |
✓ |
✓ |
Sub-populations have equal probability of a negative true label when their prediction is positive |
||
Equalized Odds |
✓ |
✓ |
✓ |
Sub-populations have equal true positive rate and equal false positive rate |
|
Error Rates |
✓ |
✓ |
Sub-populations have equal probability of a false prediction |
||
Theil Index |
✓ |
✓ |
Error rates are the same for sub-populations and whole population (deviations are measured using entropy) |
[1] Moritz Hardt et al. “Fairness and Machine Learning: Limitations and Opportunities”. 2019.
For maximal versatility, all supported metrics are offered under two formats:
A scikit-learn-like
Scorerobject which can be initialized and reused to test different models or datasets.A functional interface that can easily be used for one-line computations.
Unintended Bias Detection
The guardian_ai.fairness.metrics module
provides metrics dedicated to assessing and checking whether the model
predictions and/or true labels in data comply with a particular fairness
metric. For this example, we will take a look at the statistical parity
metric. This metric, also known as demographic parity, measures how much
a protected group’s outcome varies when compared to the rest of the
subgroups. Thus, such fairness metrics denote differences in error
rates for different demographic groups/protected attributes in data.
Therefore, these metrics are to be minimized to decrease
discrepancies in model predictions with respect to specific groups of
people. Traditional classification metrics such as accuracy, on the
other hand, are to be maximized.
Measure the Compliance of a Model with a Fairness Metric
In the
context of the Adult Census Income dataset, if we want to measure
fairness with respect to the sex attribute, statistical parity
corresponds to the disparity between the model’s rate of predicting a
>50k income between men and women. Model fairness metrics are
available as scikit-learn compatible scorers, taking in a list of
protected_attributes at creation and then being called with a
model, X, and y on which to measure fairness. By default, the
fairness metric will measure the difference between a subgroup’s
outcome and that of the rest of the subgroups, returning the mean
disparity over all subgroups. These two options can be changed at the
creation of the metric, using the distance_measure and reduction
arguments, respectively.
Load The Data
from sklearn.datasets import fetch_openml
from sklearn.model_selection import train_test_split

dataset = fetch_openml(name='adult', as_frame=True)
df, y = dataset.data, dataset.target

# Several of the columns are incorrectly labeled as category type in the original dataset
numeric_columns = ['age', 'capitalgain', 'capitalloss', 'hoursperweek']
for col in df.columns:
    if col in numeric_columns:
        df[col] = df[col].astype(int)


X_train, X_test, y_train, y_test = train_test_split(df,
                                                    y.map({'>50K': 1, '<=50K': 0}).astype(int),
                                                    train_size=0.7,
                                                    random_state=0)

X_train.shape, X_test.shap
((34189, 14), (14653, 14))
Train a Model Using Scikit-learn
We first train a simple sklearn random forest and then evaluate its performance and fairness.
from sklearn.pipeline import Pipeline
from sklearn.ensemble import RandomForestClassifier
from sklearn.preprocessing import OneHotEncoder

sklearn_model = Pipeline(
    steps=[
      ("preprocessor", OneHotEncoder(handle_unknown="ignore")),
      ("classifier", RandomForestClassifier()),
      ]
)
sklearn_model.fit(X_train, y_train)
We use the roc_auc_score scoring metric to evaluate the performance
of this model on unseen data (X_test).
from sklearn.metrics import roc_auc_score

y_proba = sklearn_model.predict_proba(X_test)
score = roc_auc_score(y_test, y_proba[:, 1])

print(f'Score on test data: {score:.2f}')
Score on test data: 0.90
Now, we can also compute the statistical parity of the model on test data.
from guardian_ai.fairness.metrics import ModelStatisticalParityScorer

fairness_score = ModelStatisticalParityScorer(protected_attributes='sex')
parity_test = fairness_score(sklearn_model, X_test)
print(f'Statistical parity of the model (lower is better): {parity_test:.2f}')
Statistical parity of the model (lower is better): 0.18
Measure the Compliance of the True Labels of a Dataset with a Fairness Metric
Given a dataset with some ground truth labels, we can
check whether those true labels satisfy a particular fairness metric of
concern. In this context, statistical parity measures the disparity of
positive label rates between subgroups and the rest of the subgroups.
Dataset fairness metrics are available as scikit-learn compatible
scorers, taking in a list of protected_attributes at creation and
then being called with a model, X and y on which to measure
fairness, with model being an ignored and optional argument.
from guardian_ai.fairness.metrics import DatasetStatisticalParityScorer

DSPS = DatasetStatisticalParityScorer(protected_attributes='sex')

parity_test_data = DSPS(X=X_test, y_true=y_test)
Dataset fairness metrics are also available as functions taking as
inputs y_true and subgroups.
from guardian_ai.fairness.metrics import dataset_statistical_parity

subgroups = X_test[['sex']]

parity_test_data = dataset_statistical_parity(y_test, subgroups)
print(f'Statistical parity of the test data (lower is better): {parity_test_data:.2f}')
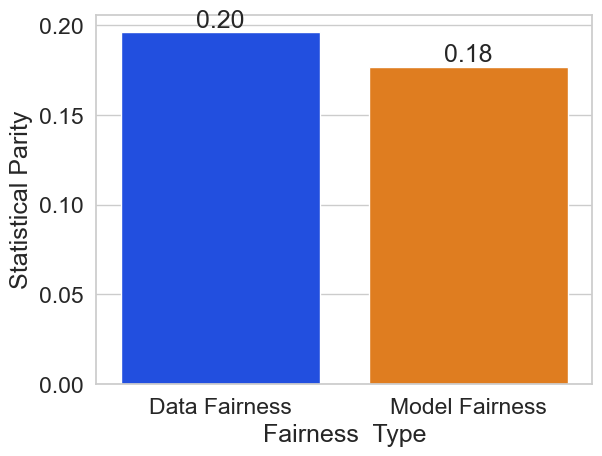
Statistical parity of the test data (lower is better): 0.20
We can see here that the test set of the Adult Census Income Dataset has
a statistical parity with respect to sex of 0.20, meaning that men
have 20% more >50k labels than women. Interestingly, the dataset’s
statistical disparity (0.20) is less than the tuned model’s
(0.33), highlighting that a trained model can amplify the unintended
bias that is contained in the dataset.
ax = sns.barplot(
        x='Fairness  Type',
        y='Statistical Parity',
        data=pd.DataFrame({
            'Fairness  Type': ['Data Fairness', 'Model Fairness'],
            'Statistical Parity': [parity_test_data, parity_test_sklearn_model],
        })
)
ax.bar_label(ax.containers[0], fmt='%.2f')
[Text(0, 0, '0.20'), Text(0, 0, '0.18')]
Other Fairness Metrics
Statistical parity is only one of the many supported fairness metrics. As another example, we can compute Equalized Odds, which measures the disparity of a model’s true positive and false positive rates between different subgroups of the data based on demographic information/protected attributes.
from guardian_ai.fairness.metrics import EqualizedOddsScorer

fairness_score = EqualizedOddsScorer(protected_attributes='sex', distance_measure='diff')
EO_original = fairness_score(sklearn_model, X_test, y_test)
print(f'Equalized odds on test data (lower is better): {EO_original:.2f}')
Equalized odds on test data (lower is better): 0.12
We can also easily compute these fairness metrics on more than one protected attribute.
fairness_score = EqualizedOddsScorer(protected_attributes=['sex', 'race'], distance_measure='diff')
EO = fairness_score(sklearn_model, X_test, y_test)
print(f'Equalized odds on test data (lower is better): {EO:.2f}')
Equalized odds on test data (lower is better): 0.20
Note that, unlike statistical parity, we cannot compute equalized odds
on the dataset since it is dependent to model output. However, we can
compute other metrics on the dataset like Smoothed EDF; it is
computed as the minimal exponential deviation of positive target ratios
comparing a subgroup to the rest of the subgroups.
from guardian_ai.fairness.metrics import smoothed_edf

subgroups = X_train[['race', 'sex']]
smoothed_edf_score = smoothed_edf(y_train, subgroups)
print(f'Smoothed EDF score on train data: {smoothed_edf_score:.2f}')
Smoothed EDF score on train data: 1.71